With the growth of Internet, we have seen staggering growth in data too. Data is believed to be pure gold. By leveraging this data, one can derive actionable insights that can propel business into a new stratosphere.
Sounds easy, doesn’t it?
The only hitch is that data is raw and means nothing as it is. 90 percent of data that you see in digital space is unstructured. Hence, having access to data alone does not open any golden locks.
This is where data mining comes in.
Data mining is the process through which you can decode the large chunks of data, unlock the patterns and uncover insights that can help you predict future trends. However, data mining takes its cue from three different fields such as machine learning, statistics, and database systems.
Why data mining is vital to your quest for actionable intelligence is that it allows you to navigate large datasets and enables you to glean the trends. With data mining, you can discriminate between what is relevant and what is not. Consequently, you can focus only on the relevant and get rid of the baggage of a lot of data which will otherwise consume your valuable time and energy. Once you only deal with the relevant bits, you can power your business with informed decisions.
In many ways, data mining has increasingly become imperative and it is no longer possible to ignore the significance and application of data mining.
However, you might wonder how to leverage data mining and if there are any specific data mining techniques that you can capitalize on.
Well, no worries.
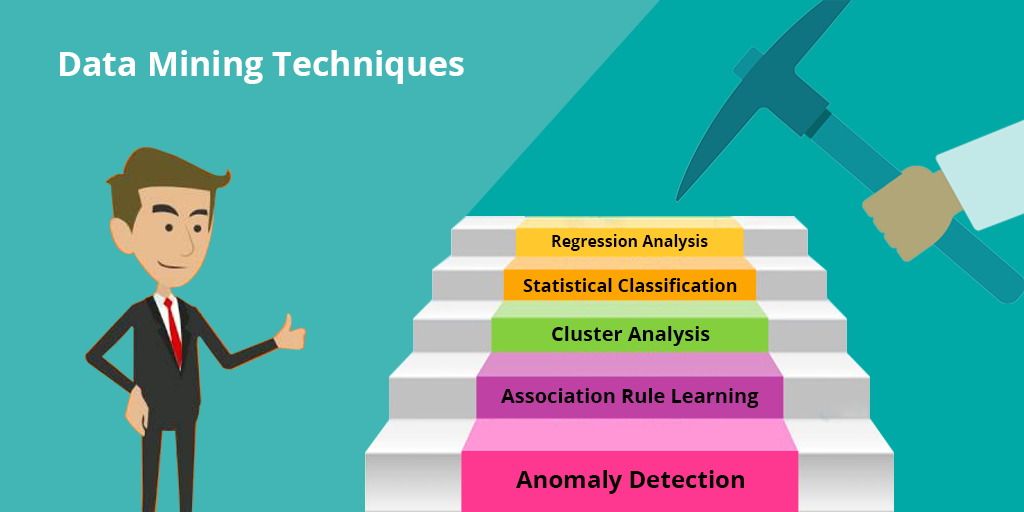
We have put together the top 5 data mining techniques for you.
Let’s get started.
Before we get started, here’s the definition of data mining:
Data mining is the process of finding anomalies, patterns, and correlations within large data sets involving methods at the intersection of machine learning, statistics, and database systems.
Discover How ProWebScraper Extracts Millions of Data Effortlessly
Scalable: Handle large-scale scraping needs with ease.
Robust QA: Hybrid QA process for accurate data extraction.
Uninterrupted Scraping: residential proxies that never get blocked while scraping.
Here’re 5 data mining techniques that you can leverage for your respective needs.
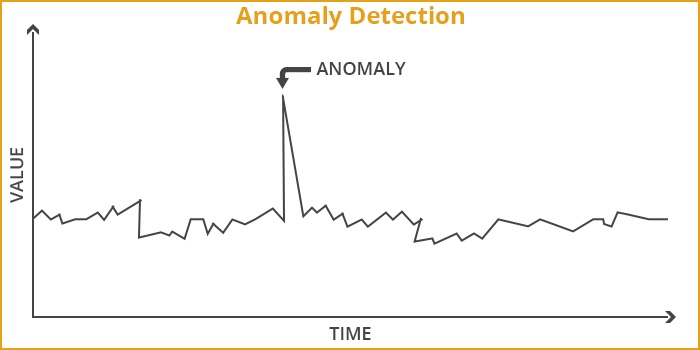
1. Anomaly Detection
What is Anomaly Detection?
Anomaly, as the word suggests, stands for an exception or aberration. In the context of data mining, Anomaly Detection, also known as outlier detection, is basically all about discovering the rare items or items that don’t fit. In other words, when one detects data that deviates from the trend, it is called Anomaly Detection. It could be items, events or observations that buck the trend.
Since an anomaly deviates from the trend, it is also aptly termed as outlier, noise, changepoint, novelties, deviations, and exceptions etc.
Generally speaking, Anomalies are patterns that deviate from the main or larger pattern.
Let’s assume that census data indicates that household income is in the range of $80000 and $100000, and there are a few households which claim to have an income of $200000. These cases of outliers would be considered as anomalies.
Basically, there are three types of anomalies:
Point anomalies: In this case, you can observe one object against other objects as anomaly. That’s why it’s called point anomaly. For instance, when you discover a large transaction value against a series of small transactions, it is a point anomaly.
Contextual anomalies: It is also known as conditional anomaly. When an object deviates from the larger pattern in a specific context, it is considered contextual anomaly. For instance, if some deviation happens at a particular time period or in a particular region, it would be termed as contextual anomalies. A spike in stock prices at a particular time would qualify as contextual anomaly.
Collective anomalies: This type of anomaly refers to a deviation in a collection of related data instances vis-à-vis entire dataset but not with individual values. For instance, a break in rhythm in ECG would be considered a collective anomaly.
Why Anomaly Detection?
Anomaly detection technique has varied applications in diverse fields such as the following:
Image Processing: It can be quite useful in detection of a deviation in terms of unusual images when it comes to surveillance in public sector.
Fraud Detection: In recent times, there has been a surge in crimes in sectors such as Banking and Finance. A number of frauds occur in various financial institutions such as banks, credit card companies, insurance agencies, cell phone companies, stock market etc. It can also be used to detect criminal activities occurring in these organizations.
Intrusion Detection: It is helpful in detection of different activities which involve intrusion of some sort. For instance, malicious activities such as break-ins, penetrations, and other forms of computer abuse in a computer related system in IT industry can be detected with the help of anomaly detection.
Industrial Damage Detection: Industrial units contain a lot of expensive equipments and other items. These units normally experience some or the other damages. However, it is imperative that such damages are detected early on otherwise the damages can lead to potentially massive losses. Since different sensors record this sort of data for further analysis, it is called sensory data. Anomaly detection techniques are used widely for detection of such damages.
Medical and Public Health Anomaly Detection: Anomaly detection technique is used quite effectively in this domain. When doctors detect seizure or tumor by conditional monitoring on patient data, anomaly detection technique is at work here.
Event Detection in Sensor Networks: With the help of anomaly detection techniques, it is possible to identify sensor fault detection and events such as intrusions by collecting data from a sensor network.
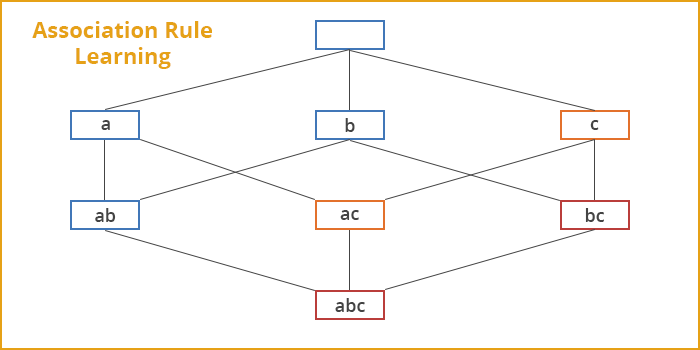
2. Association Rule Learning
What is Association Rule Learning?
Association rule learning is a rule-based machine learning method which enables you to identify different kinds of relations between variables in large databases.
What this technique accomplishes is that it can uncover some underlying patterns in the data. These patterns then can be used to find out variables within the data and the concurrence of different variables that occur quite frequently in the dataset.
For example, the rule {onions, potatoes} => {burger} found in the sales data of a supermarket would suggest that if a customer purchases onions and potatoes together, he/she is likely to also buy hamburger meat. While this information looks unimportant at first, it is used in the decision-making related to marketing. For instance, this information can be the basis for pricing, promotion or placement of products in the marketplace.
This technique is also useful in working out strong rules discovered in databases using 3 measures of interestingness.
Support: Support is all about how an item or an itemset frequently occurs in all of the data. In other words, it indicates how popular it is in the dataset in question.
Confidence: Confidence is about how often the rule has been found to be true.
Lift: Lift refers to the ratio of confidence to expected confidence. Lift is a value that gives us information about the increase in probability of the “then” given the “if” part.
Why Association Rule Learning?
Association rules are applied in many real-life applications such as the following:
Market Basket Analysis: It is quite useful when one wants to find out the relationships that exist among the different items that a customer purchases. There is a correlation between the place where an item is placed and the items eventually sold. The placement of an item at a particular place influences the sales. Hence, when one studies the information regarding the items sold, it will be possible to figure out which items were placed next to each other in the store.
Medical Diagnosis: With the help of relational association rule mining, it is possible to find out the probability of the occurrence of an illness pertaining to various factors and symptoms. Moreover, if one uses machine learning techniques, it is possible to extend this interface by adding new symptoms and defining relationships between the new symptoms and the corresponding diseases.
Census Data: A lot of census data has been compiled by every government over the years. However, this data needs to be decoded in order to leverage it for policy planning, public services such as education, health, transport etc. It can also be used to help set up new factories, shopping malls, and even marketing particular products. Association rules are quite effective in all of these.
Web Log Data Mining: It is about finding out user information not seen by most people. It is, therefore, called the web procedure mining. Based on this information, it is possible to find out the way users behave. Such data proves extremely useful for marketing and creating user profiles.
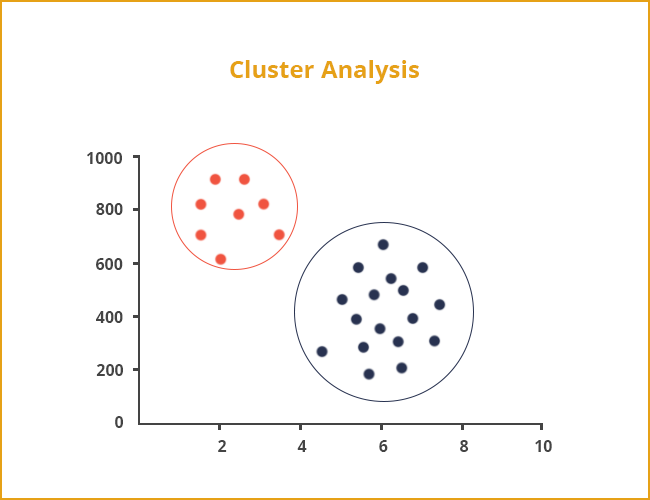
3. Cluster Analysis
What is cluster analysis?
Clustering is basically an unsupervised machine learning approach. Cluster analysis is a statistical method which is employed to group similar objects into respective categories.
Why cluster analysis is carried out is to group together a bunch of objects in a way that objects in the respective group called a cluster are more similar to one another compared to those in other groups (clusters).
Clustering can be classified as follows:
Hard clustering: It is a form of clustering where data is divided into distinct clusters, where each data point can only belong to exactly one cluster
Soft clustering (also known as fuzzy clustering): It is a form of clustering in which each data point can belong to more than one cluster.
Let’s take the example of data on drug-related crimes in Canada. It is basically the data that pertains to crimes due to various drugs that include Heroin, Cocaine and prescription drugs used especially by underage people.
With the help of cluster analysis, it is possible to categorize the crimes based on the abuse substance to detect prominent cause.
Why cluster analysis?
Clustering has an array of applications in a variety of domains. Here’re some of the well-known applications:
Market Research: Cluster analysis helps find groups of customers with similar behavior from a large database of customer data which contains their properties and past buying records.
Image Segmentation: It can be used to divide a digital image into distinct regions for border detection or object recognition.
Data Summarization: It is possible to create a summary of the data from clusters as clusters can be considered similar groups of records.
Recommendation Engine: It basically recommends new items to users on the basis of user’s taste. Clustering algorithms are used at times to predict a user’s preferences based on the preferences of other users in the user’s cluster.
Crime Analysis: Once the “hot spots”, places where a similar crime has happened over a period of time are identified, it is possible for law enforcement agencies to manage its resources far more judiciously.
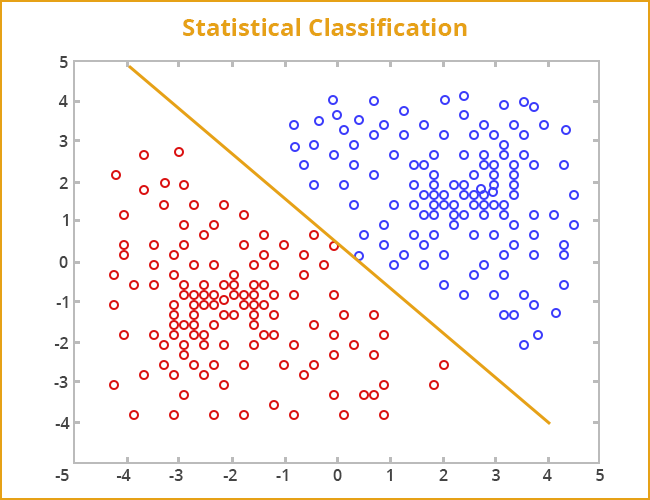
4. Statistical Classification
What is Statistical Classification?
This is a prominent data mining technique. However, it is based on supervised machine learning approach.
Classification is a data mining function that assigns an object to a target classes or categories, based on training set of data containing observations whose category or class membership is known.
In order to predict the target class for each case, classification is used. It can be perceived as two distinct problems:
Binary classification: Binary classification is the problem of classifying instances into only two classes.
Multi class classification: Multiclass or Multinomial classification is the problem of classifying instances into one of three or more classes.
For example, an email of text can be classified as something that belongs to one of two classes: “spam” and “not spam“.
Why Statistical Classification?
Marketing: It is used to find out segments of the population which have potentially high quotient of positive responders with respect to a marketing campaign.
Text Classification: It is useful in classifying free-text to predefined categories for performing sentiment analysis, language detection, spam filtering, etc.
Credit Analysis: It is applied in classifying individuals by credit score in order to determine who qualifies for a loan (at what interest rate and credit limits).
Biological Classification: It is used to organize species into larger groups and to discover relationships among organisms, both living and extinct by analyzing organism’s characteristics.
Speech Separation: It is also useful in classifying voice to automatic speech and speaker recognition, hearing prosthesis.
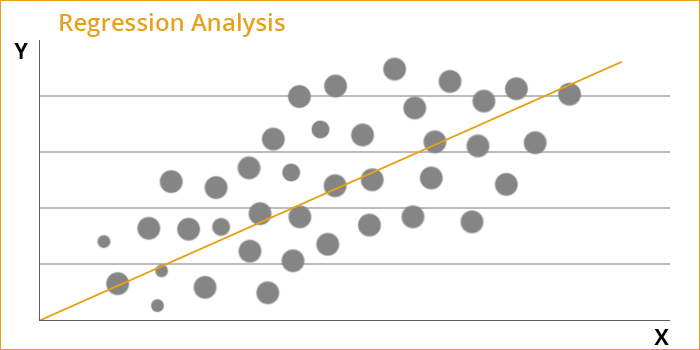
5. Regression Analysis
What is Regression Analysis?
Regression analysis is a statistical method which enables you to analyze the relationship between two or more variables of interest.
It is useful in understanding how the value of the dependent variable changes when the value of one of the independent variable also goes through change. The other remaining independent variables may maintain their value.
For example, after studying the data related to a chunk of houses over a period of time, it is possible to predict house values using regression model. Apart from the value, it is possible to track the age of the house, square footage, number of rooms, taxes, school district, proximity to shopping centers, and so on. In such an analysis, the house value would serve as the target whereas the other attributes would serve as the predictors. The data for each house would serve as a case.
Why Regression Analysis?
Here’re some of the applications of Regression Analysis:
Sales or Market Forecasts: It is immensely useful in forecasting sales volumes or market movement in order to devise plans for the future growth of the company.
Risk Analysis for Investments: Using linear regression, it is possible to measure the volatility of a stock or investment.
Quality control: Regression analysis is also used to analyze key product specifications and other measurable parameters of product or organizational quality (such as number of customer complaints over time, etc).
Human Resources: Regression analysis has its application in the field of HR as well. With its help, it is possible to predict the demographics which will directly affect the company. It is also useful in predicting the kind of future workforce that the company will have. Once this kind of analysis is available, the companies can plan for the future in terms of the human resource requirements. They can work out effective hiring plans or training programs for the existing employees as well.
Since there is phenomenal growth in data, it has become imperative to mine the data and glean the actionable insights and intelligence. This is why we have witnessed a surge in the applications of data mining techniques.
With businesses going online, there’s a lot of data piling up in different industries such as banking and finance, manufacturing etc. Until and unless the data collected in different ways is analyzed appropriately, it is of no real significance. Therefore, data mining techniques are now getting used quite extensively in these different industries.
Whether it is business prospects, risk assessment, social media or anything else, data mining techniques have emerged as an integral part of policy making and strategic planning for companies across the globe.
Hence, it is apt to argue that those who will leverage data mining techniques more aggressively will acquire a competitive edge in terms of revenues, customer relationships and business growth!